Crypto Fundamentals
Data driven cryptocurrency insight
✅ Industry standard Tradingview chart
✅ Time series data
✅ Compare multiple series in same graph
✅ Toggle Data, property, and scale
This application is an analytics tool for analyze cryptocurrencies and their network.
Crypto Fundamentals offers data, visualization, and metrics to provide information to assist in valuation.
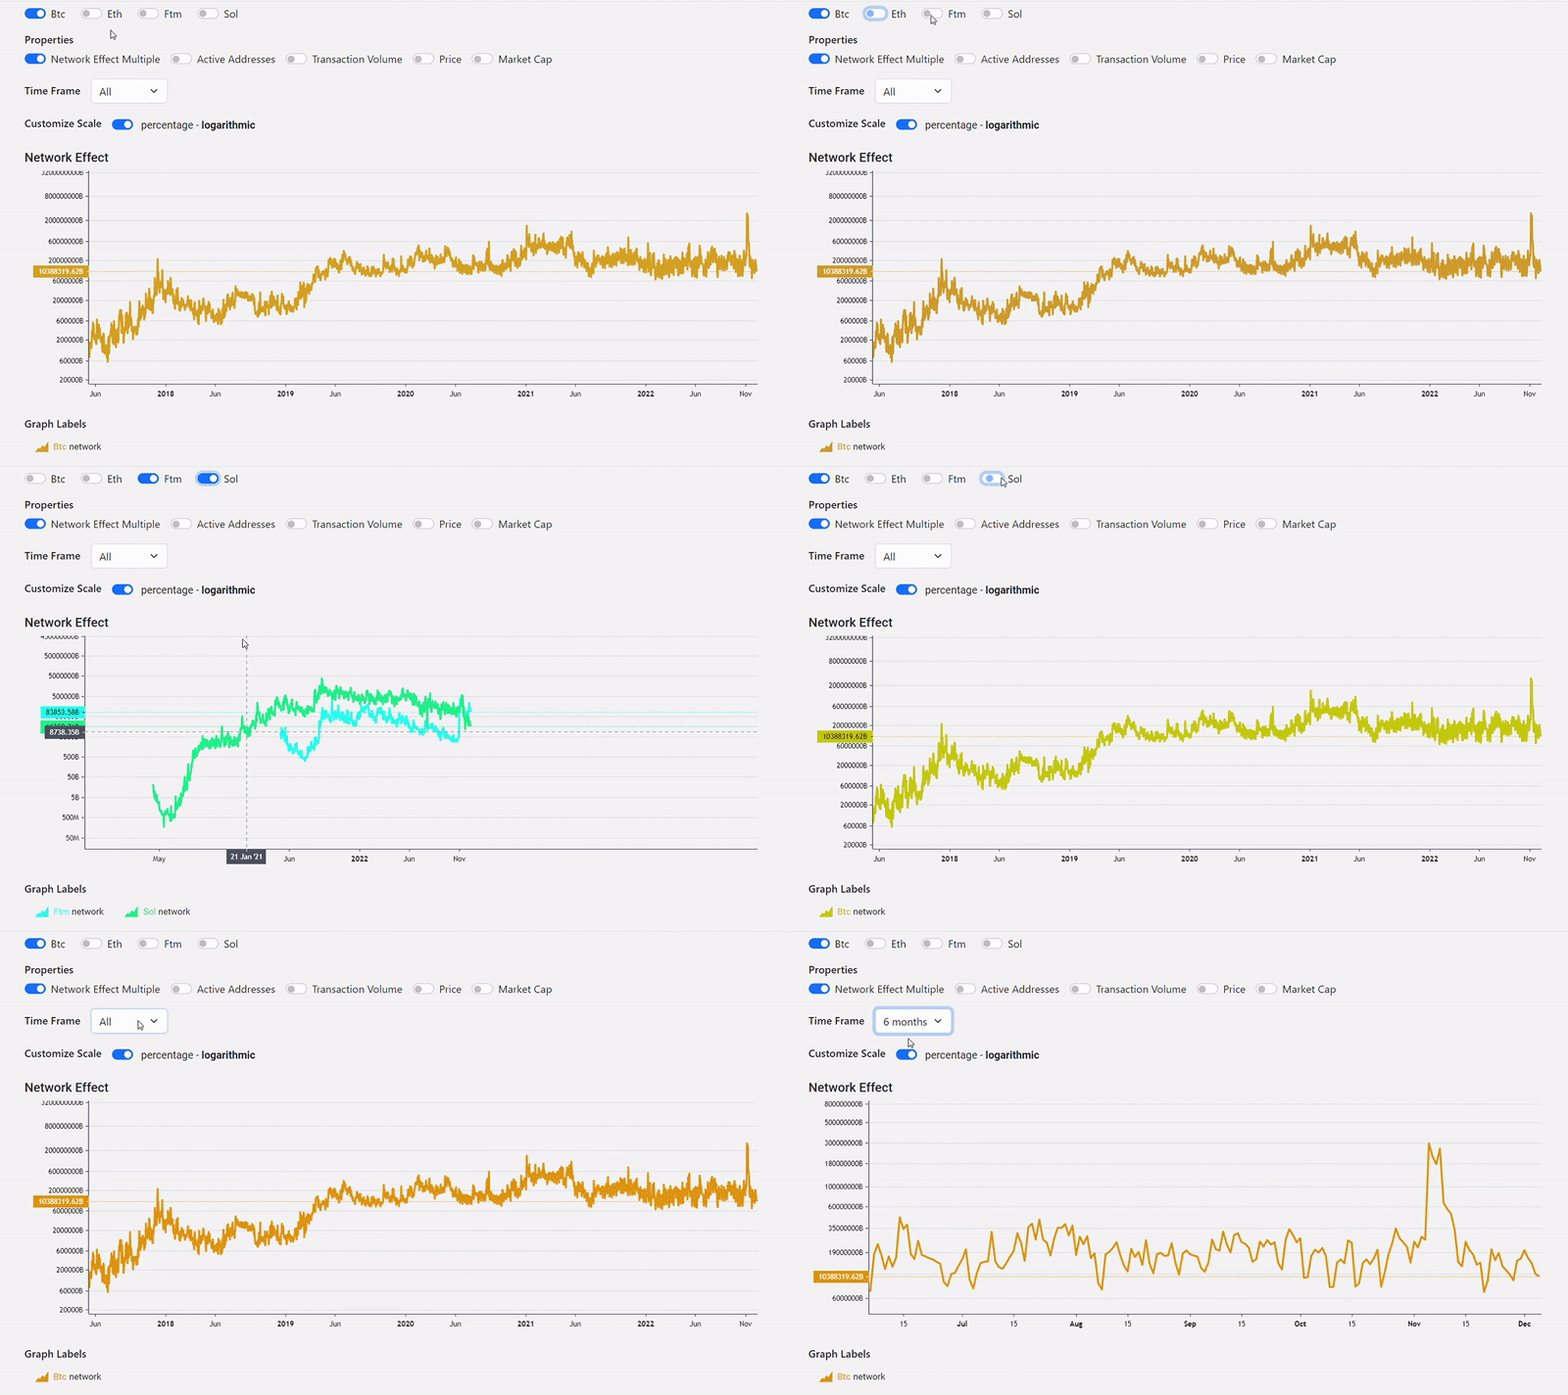
With the metric pages you can use the graph toggles to change graph display. Note the graph will display more or less datasets depending on the toggles activated.
The time frame can be adjusted from the dropdown. The scale can be changed from logarthimic to percentage.


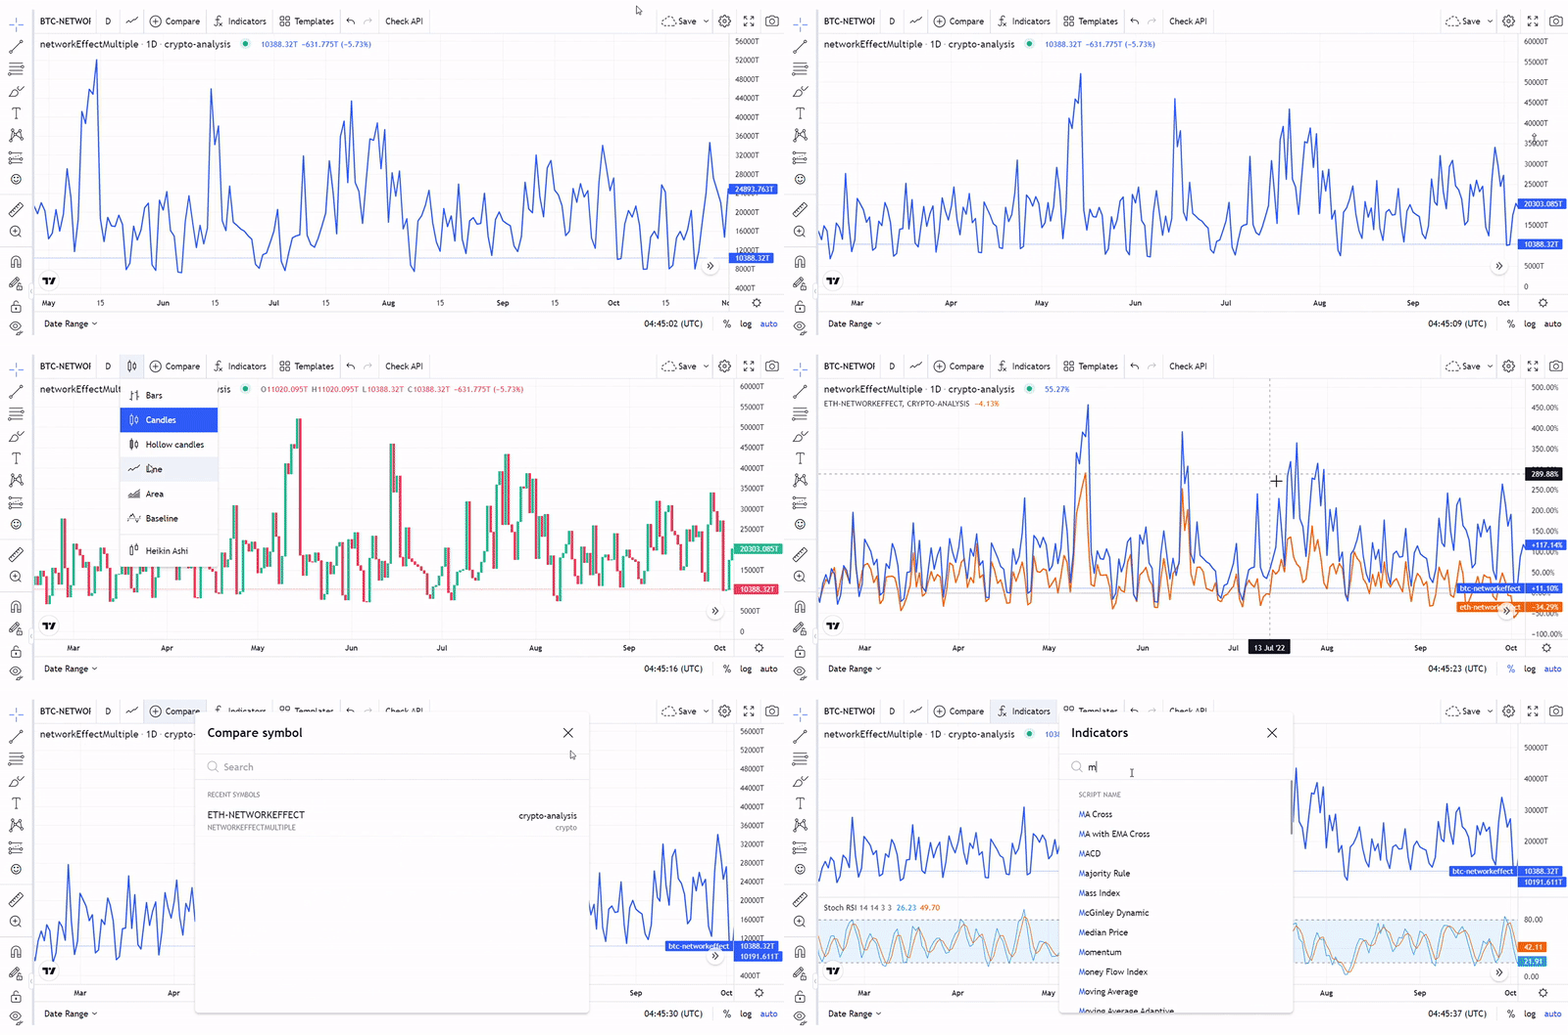
There is also a TradingView mode that can be used to interact with the datasets.
Here you can perform most TradingView chart actions: change line type, compare series, use indicators, and more.
Fundamental analysis involves looking at any data which is expected to impact the price or perceived value of a stock. This is, of course, anything aside from the trading patterns of the stock itself, As the name implies, it means getting down to basics.
Fundamental analysis focuses on creating a portrait of a company, identifying the fundamental value of its shares, and buying or selling the stock based on that information. - Investopedia
Source
These conscientious investors are able to spot the market's mistakes and make themselves money. At the same time, buying companies based on intrinsic, long-term value protects investors from the dangers of day-to-day market fluctuations.
View each metrics for all cryptocurrencies